06/05/2016: Dynamic visualization of commuting flows in Belgium (2001)
Thanks to Peter Ellis and R Bloggers
Thanks to Peter Ellis and R Bloggers
30/04/2015: Bar chart displaying both relative and absolute change (in employment)
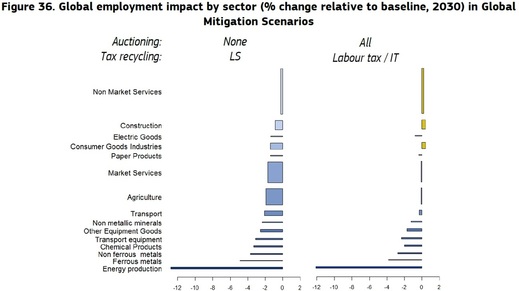
The figure below (Figure 36 in this study) shows the changes in employment per sector for 2 scenarios. The width of the bars represents the (re-scaled) number of jobs in each sector in the baseline; the length of each bar indicates the percentage change in the scenario with respect to the baseline. As a result of this visual presentation, the surface of each bar represents the change in absolute number of jobs.
A neat way to show both absolute and relative numbers in one chart!
The figure was made in R (open-source software) and the code can be found below (file can also be opened with e.g. Notepad).
| bar_chart_employment_tvotw.r |
07/07/2014: data on Greenhouse Gas emissions.
The file unfccc_tvotw.xlsx contains data on GHG emissions. The source is UNFCCC. Data is freely accessible, but I found the data extraction somewhat time-consuming if you want a high degree of sector detail. The Excel sheet includes emission data by sector for all Annex I countries, from 1990 to 2012, for the greenhouse gasses CO2 (CO2 from industrial processes is labelled CO2C), CH4, N2O, PFC's, HFC's and SF6. The highest degree of detail is not always included, but I still hope this can save you some time. Emissions from category 5. LULUCF are excluded entirely. If you find inconsistencies, errors or missing data, please let me know.
The file emissions_unfccc_tvotw.gms contains accompanying GAMS code that can be used to read the data from the Excel file, do aggregations and write the output to a GDX file.
|
| ||||
